Table of Contents
For years, I thought “good analytics” just meant having clean dashboards and a solid spreadsheet workflow. Then I started seeing AI tools creep into every part of the process—cleaning data, summarizing results, and even helping write the code to get there. And honestly? It’s changed how I work.
AI for data analytics tools isn’t just a buzzword anymore. It’s the reason teams can spot patterns faster, ask questions in plain English, and turn messy inputs (especially text) into something usable for real decisions. If you’re trying to keep up with customer behavior, campaign performance, or market shifts, AI makes the whole loop—collect → analyze → act—feel a lot less painful.
In this post, I’m going to walk through the most useful AI for data analytics tools I’ve come across, what they’re actually good at, and where they can trip you up. Because no matter how smart the model is, your workflow still matters.
Top AI Tools for Data Analytics
1. ChatGPT
ChatGPT (OpenAI) is one of the easiest ways I’ve found to speed up text-heavy analysis. If your “data” is actually a pile of emails, support tickets, reviews, or survey comments, it helps a lot to have a model that can read and summarize language-based inputs quickly.
Under the hood, it’s built on a Generative Pre-trained Transformer. In practice, that means you can ask it to explain results, draft analysis steps, or even help you generate code you can run in your own environment. No magic—just a very good writing + reasoning engine that you can steer.
Pricing-wise, it’s flexible. There’s a free plan to test the waters, and ChatGPT Plus is $20/month (in many regions) for better performance—like faster responses and more consistent access during busy times.
Use Cases in Data Analytics
What I like most is how quickly it can get you from “I know what I want” to “here’s a first draft.” For example, I’ve used it to write initial Python or R code for data transformations just by describing the goal in plain English. You still need to review the output, but you’re no longer starting from a blank file.
It’s also strong for text analysis workflows. I remember running a sentiment pass on thousands of customer reviews and then asking it to turn the results into a readable summary for stakeholders. Instead of a wall of raw data, I got something I could actually use in a meeting.
That said, it’s not a full replacement for your data stack. Since it’s primarily a text-based model, it won’t directly query your database or execute actions unless you build that connection. And if you feed it vague prompts or incomplete context, the code and analysis it produces can be sloppy. My rule: use it to accelerate drafts, then validate with your real data and tests.
2. Tableau (Tableau GPT and Tableau Pulse)
Tableau has been in analytics dashboards forever, and its AI features are aimed at helping people get to insights faster. The two features people talk about are Tableau GPT and Tableau Pulse.
Tableau GPT blends OpenAI’s enterprise-grade ChatGPT tech with Salesforce’s private AI models, which is designed to improve how you do analysis, prep work, and governance inside Tableau. Tableau Pulse is more about giving personalized metrics and insights so you’re not hunting for the “one chart” that answers your question.
One caveat: pricing for Tableau GPT and Tableau Pulse wasn’t officially published at the time of their expected Spring 2024 launch. Still, the expectation in the market is that Tableau will price these features to fit both small teams and larger orgs.
Enhance Data Visualization and Analysis
Where Tableau’s AI really shows up is in the workflow. Instead of spending hours building and tweaking views, you can use AI to speed up routine tasks like interpretation, analysis setup, and data preparation. If you’re a marketer trying to respond quickly to performance changes, that time savings matters.
I also like the “story” angle. AI isn’t just generating visuals—it can help identify trends, patterns, and anomalies you might otherwise miss. For example, it’s easier to catch a sudden spike in churn or a weird dip in conversion when the system points it out first, then you validate with your own drill-down.
And yes, Tableau’s interface still matters. In my experience, Tableau tends to be approachable for non-technical users compared to more code-heavy alternatives. The AI helps lower the barrier even further—especially if you’re new to data analytics but still need to do real work.
3. Power BI
Power BI is still one of my go-to tools when I need interactive dashboards and fast sharing across a team. What makes it stand out in the AI for data analytics space is the way AI features are embedded into Power BI Desktop, not bolted on like an afterthought.
Power BI’s AI Insights includes things like sentiment analysis, key phrase extraction, language detection, and image tagging. If you work with customer comments, multilingual feedback, or even screenshots/visual inputs, that’s a big deal. There’s also a free trial and multiple paid plans depending on what your organization needs.
AI Insights and Power BI Q&A Function
In day-to-day use, I’ve found the AI Insights feature helpful when you want to do text analytics without building a whole pipeline first. It can automate parts of Power Query for tasks like text analytics and computer vision. For marketers, sentiment analysis is the obvious win—think social posts or review snippets where you want to know whether people are reacting positively or negatively to a campaign or product.
Then there’s the Q&A function. Instead of writing complex queries, you can ask questions in plain language. For example: “What was the total revenue last quarter?” and the system returns an answer based on your model. It’s not perfect every time, but it’s fast—and it encourages more people to explore data instead of waiting on analysts.
The biggest benefit, in my opinion, is accessibility. AI makes it easier to search and explore data in real time, so you can move from “we think something changed” to “here’s what the numbers say” much quicker.
Just remember: you still need to interpret results. AI can help you get to the story, but you’re the one responsible for whether that story matches reality.
4. Microsoft Excel (Analyze Data and Microsoft 365 Copilot)

Excel has always been the “default” tool for analysis, even when people pretend they’ve moved on. And with AI features, it’s getting more useful for everyday marketers and analysts who don’t want to live in BI dashboards all day.
Excel introduced Analyze Data back in 2018. The idea is simple: you point Excel at your data, ask questions, and it suggests tables, charts, and visuals. That alone saves time when you’re trying to quickly find what’s going on.
Then came Microsoft 365 Copilot in March 2023. It’s a large language model assistant built to help across Microsoft apps—including Excel. If you’re already paying for Microsoft 365, it’s typically included as part of the subscription. The article mentions a starting price of $99 per year, but your exact plan can vary.
AI Features and Simplifying Data Analysis in Excel
Here’s what I notice with Excel’s AI: it reduces the “blank sheet” problem. Instead of figuring out which chart type fits or which summary stats to calculate, you can ask for a view and get something you can refine.
With Analyze Data, you can ask Excel about specific fields and it’ll recommend visuals that make the data easier to understand and share. For marketing reporting, that means less time building charts from scratch and more time writing the insights around them.
Copilot takes it further with a chat-style workflow (often called Business Chat). You can ask questions like: “What’s the trend of monthly sales?” and it helps you generate an output you can use right away—often including a chart or explanation. I like this for quick checks before I send a report to leadership.
Still, I wouldn’t rely on it blindly. If your data has inconsistent formatting, weird date fields, or missing categories, AI can only work with what it’s given. Clean inputs win every time.
5. Jupyter AI
Jupyter AI is a nice option if you already work in Python notebooks. It’s an AI extension for Jupyter Notebooks that feels like a coding assistant sitting next to you—helping with suggestions, explanations, and code snippets when you get stuck.
What I like about it is that it’s open-source. That matters if you’re trying to experiment without committing to expensive tooling. It leverages generative AI models to create a more conversational workflow inside your notebook environment.
Conversational assistant for coding data analysis
If you’ve ever hit a wall mid-notebook—wrong dataframe shape, confusing error messages, unclear next steps—you know the frustration. Jupyter AI helps smooth that out by suggesting what to do next and generating code you can test.
It also supports common environments like JupyterLab, Jupyter Notebook, Google Colab, and VSCode. So you’re not forced into a totally new workflow just to use AI. In my experience, that kind of compatibility is what makes tools actually stick.
Of course, you still need to understand what the code is doing. AI can generate something that runs, but it won’t automatically guarantee it’s the right approach for your dataset. Still, it can cut down the “search, copy, paste, pray” cycle.
6. Polymer
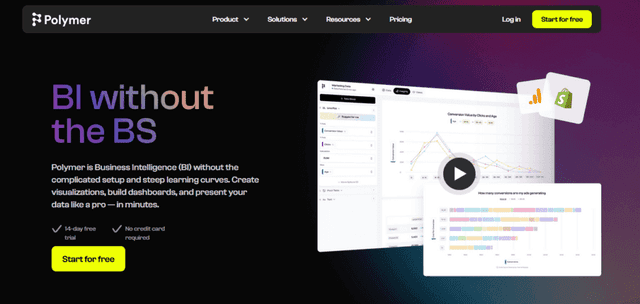
Polymer is focused on making data visualization and business intelligence more approachable. If you’re a marketer who doesn’t want to wrestle with query languages or complex chart setup, this is the kind of tool that can help you get results quickly.
The big selling point is that Polymer can automatically generate charts, tables, and maps from your dataset with just a few clicks. That’s a real time-saver when you’re trying to move from raw data to something shareable.
Pricing is tiered: Starter ($10/month), Pro ($20/month), and Enterprise ($500/month). That structure is helpful if you’re deciding based on scale and team needs.
Easy Data Visualization and Business Intelligence
In practice, what matters is how fast you can go from dataset → dashboard. Polymer’s interface is designed for quick visualization, and that’s exactly what you want when stakeholders are waiting on a report.
I also like that it’s not just “pretty charts.” The goal is to help you interpret the story behind the numbers without spending hours building every visual manually.
If you’re specifically exploring AI for data analytics and want something that feels less technical, Polymer can be a gentler on-ramp. You still need to think about what to visualize, but the heavy lifting is reduced.
7. MonkeyLearn
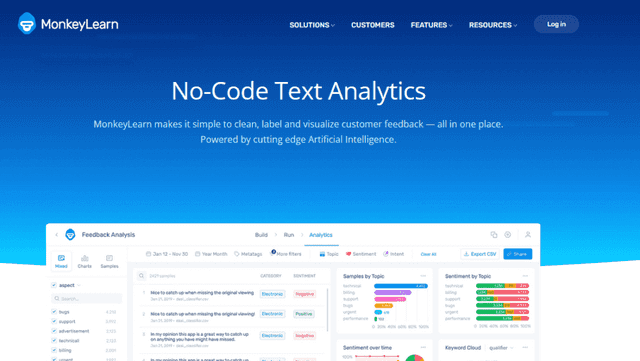
MonkeyLearn stands out because it’s built for text analysis. If you’re a marketer dealing with customer reviews, survey responses, or social mentions, this is one of the more direct ways to turn unstructured text into usable insights.
MonkeyLearn lets you build and deploy custom models for sentiment analysis, intent classification, keyword extraction, and parts-of-speech tagging. That means you can tailor the analysis to your business vocabulary instead of relying on generic assumptions.
Pricing is straightforward: there’s a free plan, and the Team plan starts at $299 (as referenced in the original content) for more robust use.
Extracting Insights from Unstructured Data
In marketing, unstructured text is everywhere. People don’t write in neat tables—they vent, praise, complain, and describe experiences in their own words. MonkeyLearn helps you extract patterns from that chaos.
For example, sentiment analysis can quickly show whether reviews are trending positive or negative. Keyword extraction can highlight what people keep mentioning most—features, issues, competitors, or specific phrases tied to your brand.
And because you can build custom models, you can classify feedback in a way that matches how your team thinks. Want to label topics like “shipping,” “pricing,” and “quality”? That’s the kind of setup MonkeyLearn is designed for.
The result is practical: you’re not just analyzing data—you’re getting insights you can use to adjust messaging, fix product issues, or prioritize campaigns.
8. Qlik Sense
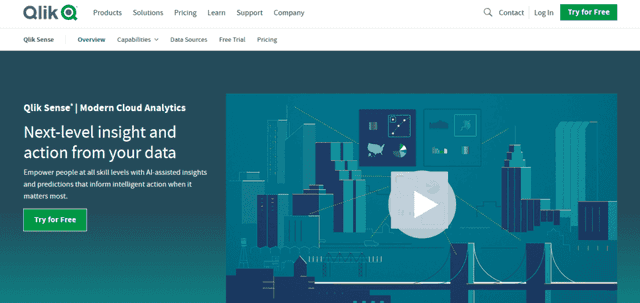
Qlik Sense is a business intelligence platform that leans into AI for data analytics and guided exploration. What I notice right away is how it tries to make discovery easier, especially if you’re not a data specialist.
It combines AI capabilities with interactive visualization features, and one standout is guided data exploration. Instead of dumping you into a dashboard and hoping you figure it out, it provides a structured path to explore your data.
The original content points to the Qlik Sense Business plan at $30/month billed annually, which could be appealing for small to mid-sized teams.
Guided Data Exploration
Qlik Sense’s AI features aren’t just about calculations—they’re about making analysis feel more intuitive. It includes automated insights for NLP, which can be useful when your dataset includes text. That’s helpful for identifying trends in customer feedback and sentiment.
The guided exploration is, in my experience, one of the reasons people actually use the tool. You can explore different facets of your data without getting stuck on “what should I click next?”
There’s also conversational analytics through Insight Advisor Chat. If you can ask questions naturally, you’ll spend less time wrestling with filters and more time finding what matters.
Overall, Qlik Sense fits well for teams who want AI for data analytics without requiring everyone to be technical.
9. Kanaries RATH
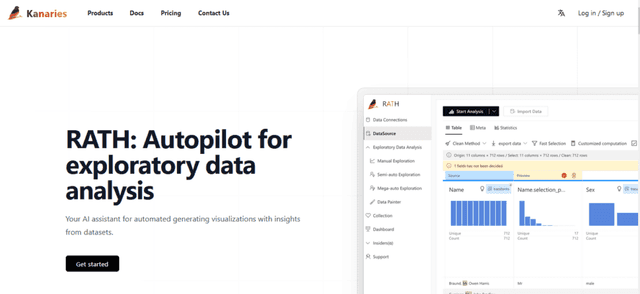
Kanaries RATH is built for exploratory data analysis, and it’s designed to feel no-code. That’s a big deal if you’re trying to do AI for data analytics but you don’t want to write scripts just to get started.
The standout feature is Data Painter, which helps generate data visualizations without you touching code. It also includes AI-enhanced data cleaning during preparation, which is the part that usually eats most of my time when I’m working with messy datasets.
Pricing is also accessible: you can use a free plan, and the paid option is $10/month (as referenced in the original content), which makes it easier for individuals and small teams to test.
AI-Enhanced Data Cleaning Features
The biggest practical win here is speed. When your data is messy—missing values, inconsistent categories, odd formatting—cleaning can derail your whole analysis. Kanaries RATH aims to handle a lot of that automatically, so you can spend more time interpreting results.
For marketers, this matters because you often need to share insights with stakeholders who don’t want to hear about your cleaning process—they want the takeaway. Automated cleaning helps you get to charts and graphs faster, without compromising reliability too much (as long as you still validate the output).
One more thing: the inclusion of PyGWalker—a no-code visual analysis interface in Jupyter Notebook—in the free plan shows they’re serious about lowering barriers for new users.
If you want a tool that streamlines the early stages of analytics and helps you explore without getting tangled in technical details, Kanaries RATH is worth a look.
The AI Revolution in Data Analytics
Switching from traditional analytics to AI-driven analysis didn’t happen overnight for me. It was gradual. I started by letting AI help with summaries and data cleanup suggestions, then moved into tools that could actually interpret patterns and generate visuals. Over time, I stopped treating manual analysis as the “default” and started treating it like a backup plan.
So why does AI matter so much for data analytics? Because it can chew through large datasets quickly and still pull out meaningful signals. Machine learning and deep learning make it possible to find patterns that would take a human a lot longer to spot—and in some cases, patterns that humans wouldn’t even think to look for.
Here’s what I’ve seen work consistently:
- Efficiency and Speed: AI can cut analysis time dramatically. Tasks that used to take days (or multiple revisions) can sometimes be done in hours—especially when you’re iterating on the same dataset.
- Predictive Analysis: AI can forecast trends using historical data. In marketing, that can mean better planning for spend, timing, and audience targeting. You still need to validate, but it’s a strong starting point.
- Accuracy: AI reduces some types of human error—like copying the wrong range, forgetting a filter, or misapplying a transformation. Just don’t assume it’s always right.
- Cost-Effectiveness: I was skeptical at first about paying for AI tools. But when automation reduces manual work, the ROI often shows up in fewer analyst hours and faster decision cycles.
- Enhanced Decision-Making: Better insights lead to better decisions. AI helps you move from “we think” to “here’s what the data suggests,” faster.
But let’s be real—there are challenges. These are the ones I watch most closely:
- Data Privacy: AI only helps if you can safely use your data. Privacy, security, and compliance (like GDPR) aren’t optional.
- Cost of Implementation: There’s often an upfront cost—licenses, setup, training, and sometimes integration work. Small teams feel this more.
- Learning Curve: AI tools still require understanding. You’ll need to learn how to frame good prompts, how to review results, and when to override the model.
AI has definitely changed the analytics game. The “magic wand” feeling is real when you go from hours of manual work to near-instant insights. And as these tools improve, the boundary of what you can analyze keeps expanding.
Benefits and Applications of AI in Data Analytics
Using AI in data analytics is like adding a supercharger—but you still need to drive well. The best results I’ve seen come when AI handles the repetitive parts (cleanup, summarization, extraction) and humans focus on strategy and interpretation.
One of the biggest benefits is automation. Repetitive tasks like cleaning messy columns, preparing datasets for visualization, or generating first-pass summaries can be handled faster and more consistently than doing it manually every time.
Another area where AI shines is predictive modeling. In tools like Power BI and Tableau, you can build models and get forecasts that help businesses plan. It won’t replace your validation process, but it can help you iterate quickly and test scenarios.
Segmentation analysis is also a strong use case. AI can help identify more nuanced audience segments and patterns—things that might get missed with simple rules-based segmentation. When you target the right segment with the right message, performance usually follows.
And then there’s text analysis, which is where a lot of marketing teams get the most immediate value. With tools like MonkeyLearn, you can analyze customer reviews and social mentions to extract sentiment, intent, and themes. That’s not theoretical—this is the stuff that changes messaging, product priorities, and campaign strategy.
To make it concrete, here are a few real-world scenarios that match how these tools are typically used:
- A retail team could use Tableau AI features to analyze purchase behavior over time, identify segments, and tailor campaigns to each group.
- A healthcare organization could use Power BI predictive modeling to forecast admissions and plan resources better.
- A marketing agency could use MonkeyLearn to classify customer feedback, pull out keywords, and summarize sentiment so clients know what’s working (and what’s not).
That’s the real value of AI for data analytics: it doesn’t just give you charts. It helps you get to actionable insights faster, so you can actually use the data instead of just reporting on it.
Considerations and Challenges
Before you roll AI into your analytics workflow, you’ve got to think about a few things. I’ve learned this the hard way—AI amplifies both good data and bad data.
Data Quality and Bias
The “garbage in, garbage out” rule is still true. If your dataset is incomplete, inconsistent, or just plain wrong, AI will confidently produce misleading outputs. On top of that, bias is a real risk. If historical data reflects biased decisions or uneven data collection, AI models can repeat those patterns.
Ethical Considerations
When AI starts influencing decisions, accountability matters. If an AI analysis leads to unfair outcomes—like biased decisions in hiring or lending—that’s not something you can ignore. You need clear ethical guidelines, human oversight, and documentation for how models are used.
Data Privacy and Security
AI tools often handle large volumes of data, which means privacy and security aren’t just “nice to have.” You should think about encryption, access controls, and compliance requirements like GDPR. And make sure stakeholders understand what data is being used and why.
The Learning Curve and Resource Allocation
AI isn’t plug-and-play. You’ll likely spend time learning the tool, refining how you provide inputs, and setting up workflows that your team can actually maintain. Some organizations also need ongoing resources for monitoring and maintenance.
Transparency and Explainability
AI can feel like a “black box,” especially when the output is a recommendation or a prediction. It’s important that your tools provide enough transparency for stakeholders to understand how conclusions are reached. Trust matters—especially when decisions impact real people.
So yeah, AI for data analytics is powerful. Just don’t treat it like a set-it-and-forget-it system. Build a strategy, set rules, and keep learning as you go.
Conclusion
After digging into the tools above, one thing is obvious: AI for Data Analytics is moving analytics forward fast. It’s automating repetitive work, helping extract insights from messy data, and making it easier for teams to ask questions and get answers without waiting for weeks of analysis.
The real opportunity is using these tools to shorten the time between insight and action. If you’re a marketer, that can mean faster campaign iteration. If you’re an analyst, it can mean more time spent on interpretation and strategy instead of grunt work.
The next step is simple: try a tool, test it on a real dataset, and see where it actually helps your workflow. And once you do, you’ll probably wonder why you waited so long.