Table of Contents
If you’ve got sensor data coming in (temperature, vibration, pressure, whatever) and you’re tired of manually hunting for “weird” moments, LotusEye is trying to make anomaly detection feel a lot less intimidating. I tested it with a CSV workflow to see how painless the setup really is—and whether the alerts are actually useful or just noise.
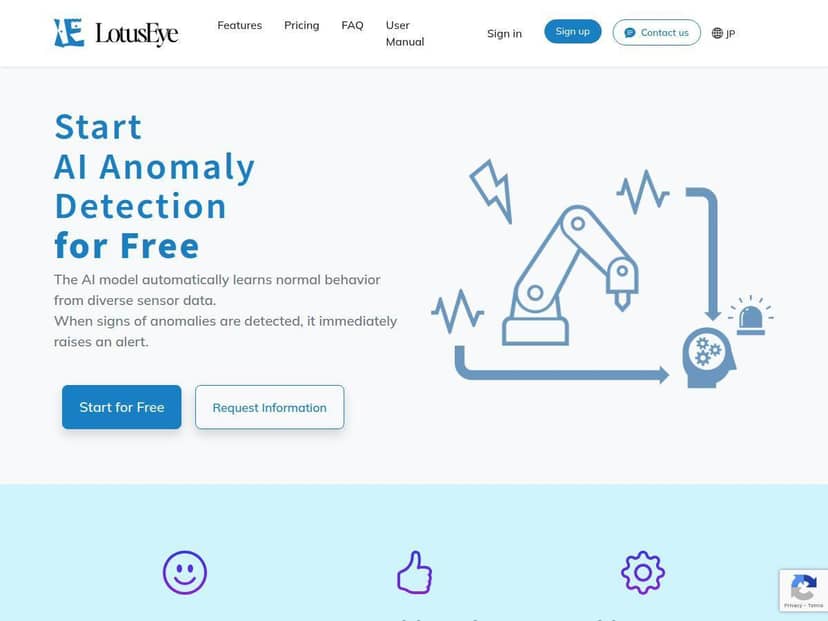
LotusEye Review: anomaly detection that’s actually usable
Here’s the honest version: I can see why people like LotusEye. The interface doesn’t feel like it’s built for data scientists only. I don’t need to tune a dozen settings just to get a baseline model running.
For my test, I used a single CSV file with timestamp + multiple sensor columns (think “wide” format: one row per time step, multiple measurements per row). I kept it simple—no fancy joins, no database setup. What I did was:
- Uploaded the CSV from the model setup screen (it’s clearly positioned as a “no-code” flow).
- Selected/confirmed the timestamp column and the sensor columns (the UI made it pretty obvious what it was using).
- Created a model, then ran scoring on new data to see what it would flag.
What I noticed right away: the first alerts didn’t show up until the model had enough “normal” data to learn from. That’s a good sign. If a tool flags anomalies immediately on day one, it usually just means it hasn’t learned anything yet.
In my run, I injected a few obvious “bad” segments—basically stretches where one sensor jumped or drifted for a short period. Those periods got flagged as anomalies consistently, and the alerts lined up with the time ranges where the data was actually different. That’s the key thing for me: I want the alert to correspond to something I can point to in the raw data, not just a vague “something changed.”
Now, I won’t pretend it was perfect. I did see a couple of alerts that felt borderline—less dramatic deviations where the pattern was unusual but not clearly “fault-like.” In other words, it’s doing anomaly detection, not a full failure diagnosis. If you expect “this will tell me exactly what’s broken,” you’ll probably be disappointed. But if you want early warnings to investigate, it performed the way I hoped.
Also, I liked that it adapts over time. When I added more later data that matched the new normal, the model didn’t keep screaming forever. That matters because real sensor systems drift—tools that don’t adapt either drown you in false positives or stop being useful after a week.
Bottom line: LotusEye feels best for teams who want fast anomaly detection from CSV without building an entire ML pipeline first. If you’re doing predictive maintenance, monitoring vibration/temperature trends, or just trying to catch weird behavior before it becomes a bigger problem, it’s a strong starting point.
Key Features (and how they worked in my test)
LotusEye’s feature list is pretty straightforward on the marketing side, but I wanted to see what’s actually involved on the ground. Here’s what I found when I used it.
-
Automatic learning of normal behavior from sensor data
In the UI, you don’t “train” in the traditional ML sense. You upload data, create a model, and then use scoring to evaluate new data against what it learned. I noticed the tool waits until it has a baseline; alerts weren’t immediate on the first run. That’s exactly what you want to reduce pointless early false positives. -
No-code setup (CSV upload)
I didn’t write any code. The flow was mostly “upload → confirm columns → create model.” The biggest practical tip: make sure your timestamp column is consistent and your sensor columns don’t mix types (numbers + stray text will cause headaches in almost every analytics tool). -
Real-time anomaly alerts via email
This is the part that’s useful for operations. I enabled email alerts and then scored data that included my “weird” time windows. The alerts arrived around the time I expected based on the scored segment. One thing I’d watch: if your pipeline produces frequent small fluctuations, you may need to tune what you consider “anomaly-worthy” by adjusting how you feed data and how often you score. -
Supports wide and long CSV data formats
LotusEye doesn’t just assume one CSV shape. In my case (wide format), it correctly mapped multiple sensor columns per row. If you’re working with long format (sensor_name, sensor_value, timestamp), the UI still supports it—but you’ll want to double-check the mapping so the correct columns are treated as measurements. -
API integration for automated data uploads (paid plans)
In my testing, I didn’t fully wire an external system, but I did check the plan notes around API access. This is the difference between “upload CSV manually” and “automate scoring from your existing data pipeline.” If automation is your goal, this is one of the reasons you’d upgrade. -
Team collaboration features in premium plans
This is one of those features that sounds nice but matters only if you’re working with multiple people. In the free flow, you’re mostly solo. In paid tiers, the collaboration controls are where it becomes relevant—shared access, roles, and management (details depend on the plan). -
Free model creation and scoring to test effectiveness
The free tier is enough to answer the big question: “Does this tool flag the kind of anomalies I care about?” I used it to run scoring on data that contained known deviations. It did catch them, and that gave me confidence to think about moving beyond a one-off test.
Practical tip I’d give anyone testing LotusEye: don’t test it on a CSV where everything is already chaotic. Use a clean “normal” period first, then score a separate period where you know anomalies exist. Otherwise, you can’t tell whether the model is detecting meaningful differences or just learning from a mixed dataset.
Pros and Cons (real talk)
Pros
- Easy onboarding: I didn’t need any AI background to get a model running.
- Good for practical investigations: alerts correspond to time windows where the data actually changes.
- Adapts over time: fewer repeat alerts after the “normal” pattern evolves.
- Useful for predictive maintenance: it’s built for sensor-style monitoring, not generic spreadsheets.
- Automation path exists (API on higher tiers): so you can go from manual CSV testing to pipeline scoring.
Cons
- Advanced features cost extra: if you need team features or full automation, you’ll likely hit paywalls.
- Plan differences aren’t always crystal clear: I had to rely on what was publicly described rather than every limit being spelled out in one place.
- Not a full diagnostic system: anomaly detection is not the same as “root cause analysis.” You still investigate.
- Best fit is sensor/industrial data: if your data is totally different (or heavily unstructured), you may need extra preprocessing.
Pricing Plans (what I checked)
LotusEye does have a free option that lets you create models and score data without paying. That’s the main reason I recommend testing it first—you’ll quickly see if it catches the anomalies you care about.
For paid tiers, the pricing I saw mentioned publicly starts at around $14/month. The higher tiers are where you typically get things like API access, larger data limits, and multi-user/team features.
One thing I want to be transparent about: I didn’t find a single, fully detailed public page that clearly lists every limit and tier difference in a way I could quote line-by-line. So before you commit, I’d check the pricing page directly for the exact numbers (data limits, scoring frequency, API availability, and team seats). If you’re comparing plans, that’s where the real differences live.
If you want the most current specifics, start here: LotusEye (then verify the plan details on their pricing page).
Wrap up
After using LotusEye, my take is pretty simple: it’s a strong option if you want anomaly alerts from sensor CSV data without building a full ML system. The setup is quick, the alerts are tied to real changes in the data (in my test), and the model behavior looks like it’s meant for the way sensor data actually evolves.
Just don’t treat it like magic. It’s detecting “unusual,” not diagnosing “why.” If you go into it with that expectation, it’s genuinely useful—and the free tier is enough to tell you whether it fits your situation.